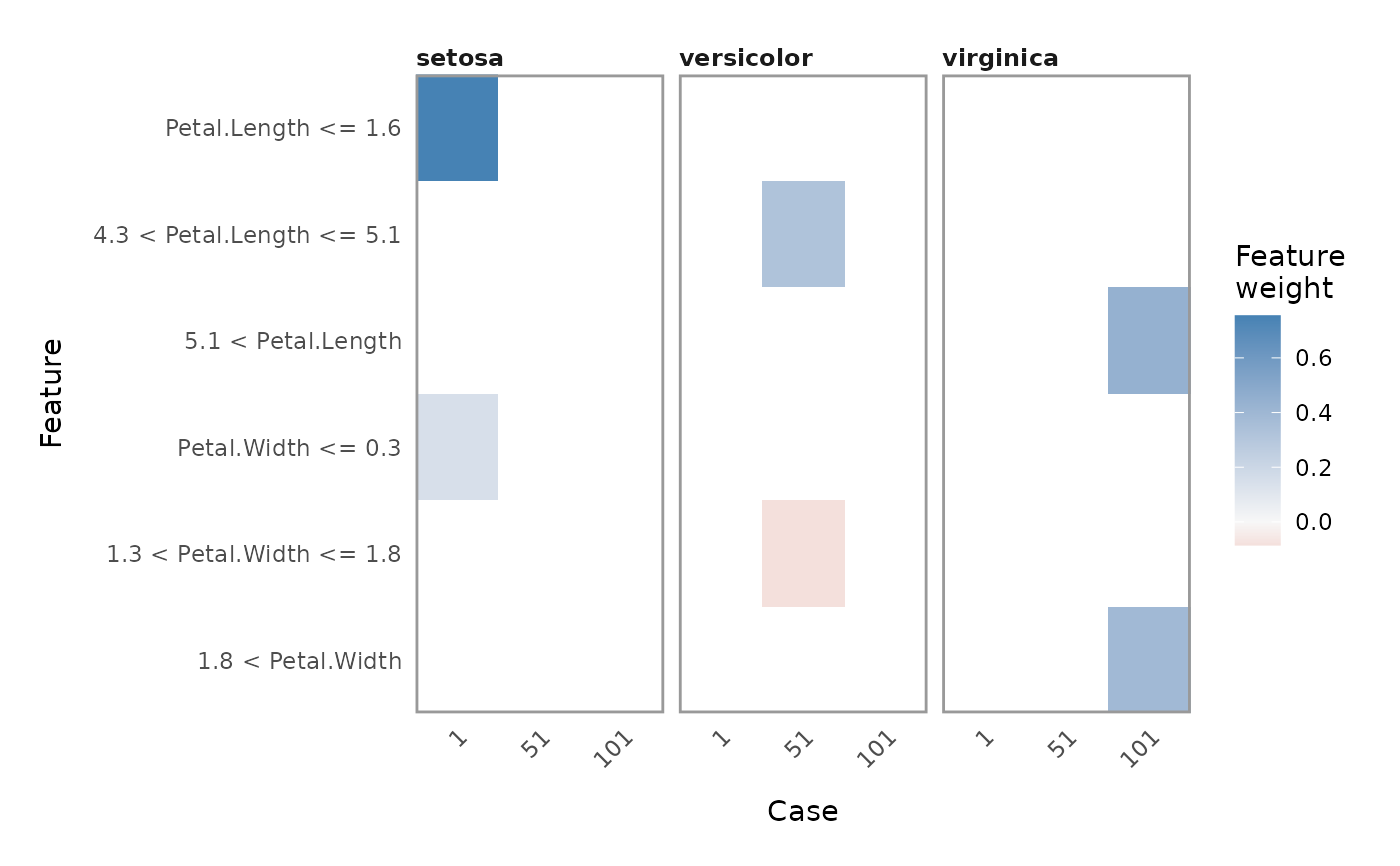
This function produces a facetted heatmap visualisation of all
case/label/feature combinations. Compared to plot_features() it is much
more condensed, thus allowing for an overview of many explanations in one
plot. On the other hand it is less useful for getting exact numerical
statistics of the explanation.
plot_explanations(explanation, ...)Arguments
- explanation
A
data.frameas returned byexplain().- ...
Parameters passed on to
ggplot2::facet_wrap()
Value
A ggplot object
See also
Other explanation plots:
plot_features(),
plot_text_explanations()
Examples
# Create some explanations
library(MASS)
iris_test <- iris[c(1, 51, 101), 1:4]
iris_train <- iris[-c(1, 51, 101), 1:4]
iris_lab <- iris[[5]][-c(1, 51, 101)]
model <- lda(iris_train, iris_lab)
explanation <- lime(iris_train, model)
explanations <- explain(iris_test, explanation, n_labels = 1, n_features = 2)

# Get an overview with the standard plot
plot_explanations(explanations)
#> Warning: `aes_()` was deprecated in ggplot2 3.0.0.
#> ℹ Please use tidy evaluation idioms with `aes()`
#> ℹ The deprecated feature was likely used in the lime package.
#>   Please report the issue at <https://github.com/tidymodels/lime/issues>.
#> Warning: The `size` argument of `element_rect()` is deprecated as of ggplot2 3.4.0.
#> ℹ Please use the `linewidth` argument instead.
#> ℹ The deprecated feature was likely used in the lime package.
#>   Please report the issue at <https://github.com/tidymodels/lime/issues>.