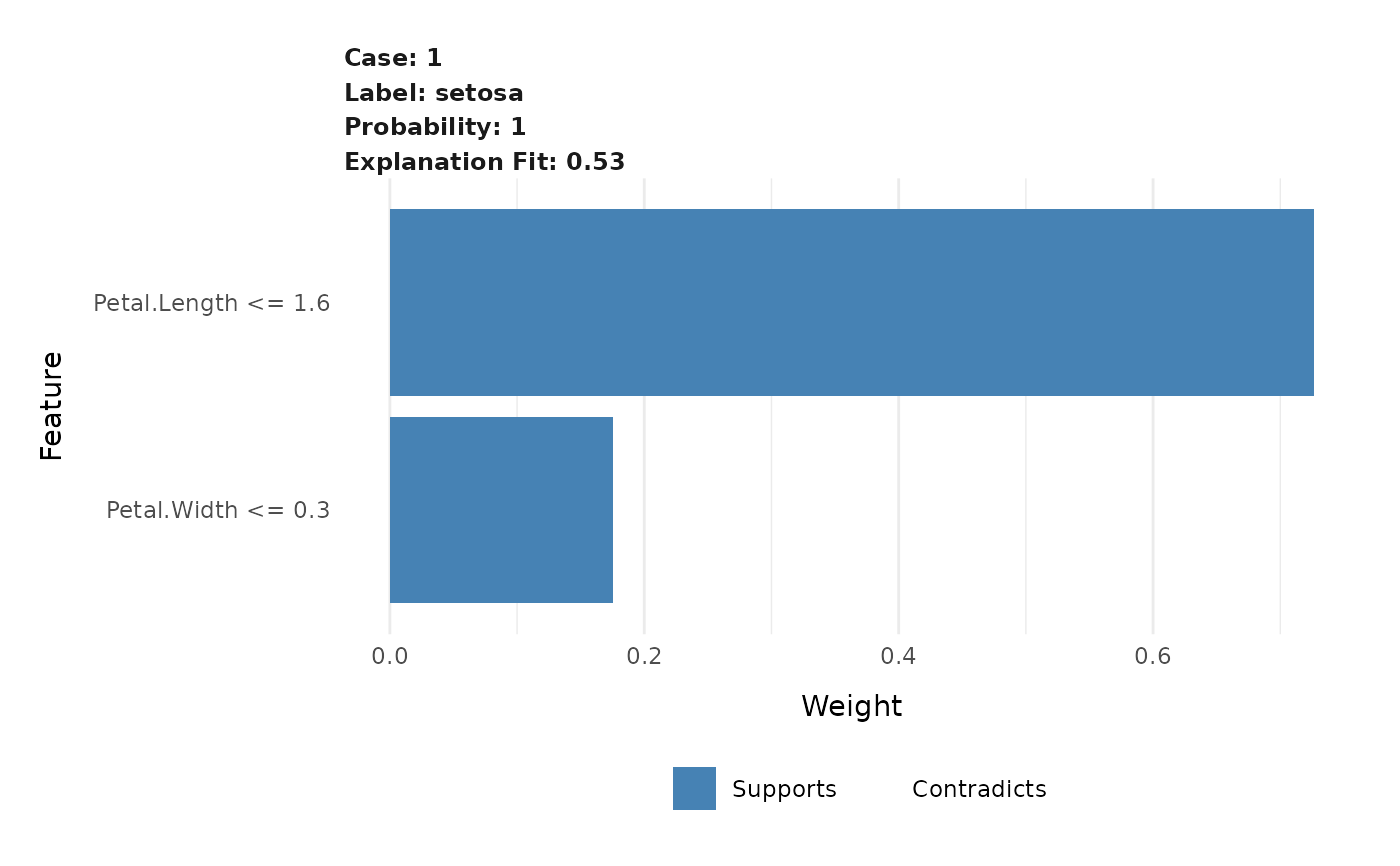
This functions creates a compact visual representation of the explanations for each case and label combination in an explanation. Each extracted feature is shown with its weight, thus giving the importance of the feature in the label prediction.
plot_features(explanation, ncol = 2, cases = NULL)Arguments
- explanation
A
data.frameas returned byexplain().- ncol
The number of columns in the facetted plot
- cases
An optional vector with case names to plot.
explanationwill be filtered to only include these cases prior to plotting
Value
A ggplot object
See also
Other explanation plots:
plot_explanations(),
plot_text_explanations()
Examples
# Create some explanations
library(MASS)
iris_test <- iris[1, 1:4]
iris_train <- iris[-1, 1:4]
iris_lab <- iris[[5]][-1]
model <- lda(iris_train, iris_lab)
explanation <- lime(iris_train, model)
explanations <- explain(iris_test, explanation, n_labels = 1, n_features = 2)

# Get an overview with the standard plot
plot_features(explanations)